From trading ideato audited evidence
Six capabilities, one loop: build, validate, review, iterate — with the boundaries stated on every one.
Charts built for inspection, not decoration
You want to read price across markets and timeframes without waiting on the chart.
What TideView does
An in-house engine renders with Canvas 2D + WebGL. Layouts sync crosshair, zoom and scroll across charts; intervals are yours to define.
What you see
Candles, Heikin-Ashi, Renko and more stay fluid at depth, across US stocks, futures, FX and crypto — plus any market packs on your plan.
The boundary
Charts display data. They never signal what to buy or sell.
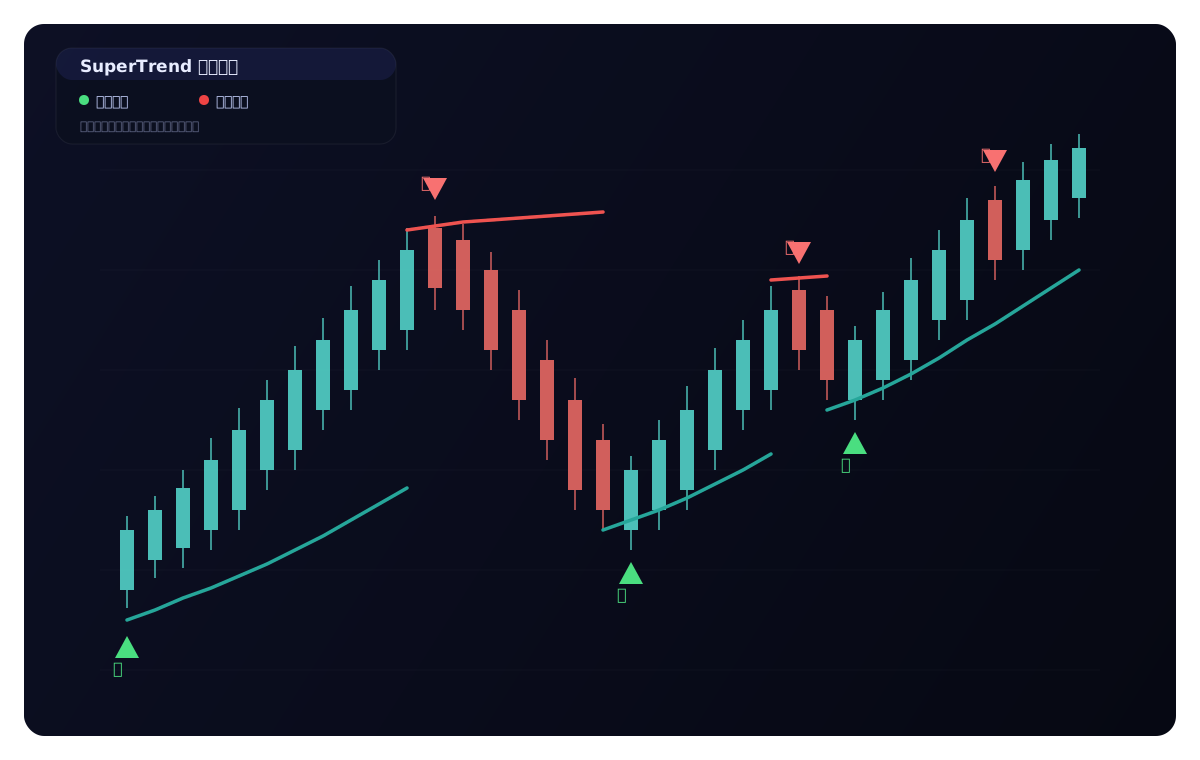
US stocks, international futures, FX and crypto in every plan; local stock markets as add-on packs
Candles, line, area, Heikin-Ashi, Renko and more chart types
In-house chart engine with Canvas 2D + WebGL rendering
Multi-chart layouts with synced crosshair, zoom and scroll
Multi-timeframe analysis with custom intervals
Your Pine scripts, carried over
You have strategies in Pine syntax and no interest in rewriting them from scratch.
What TideView does
Import the script. Anything unsupported is reported line by line, so you know exactly what carried over before you rely on it.
What you see
Edit, debug and version the strategy inside the workspace, then send it straight into validation.
The boundary
Common Pine syntax is supported — we do not claim full compatibility with every TradingView feature.
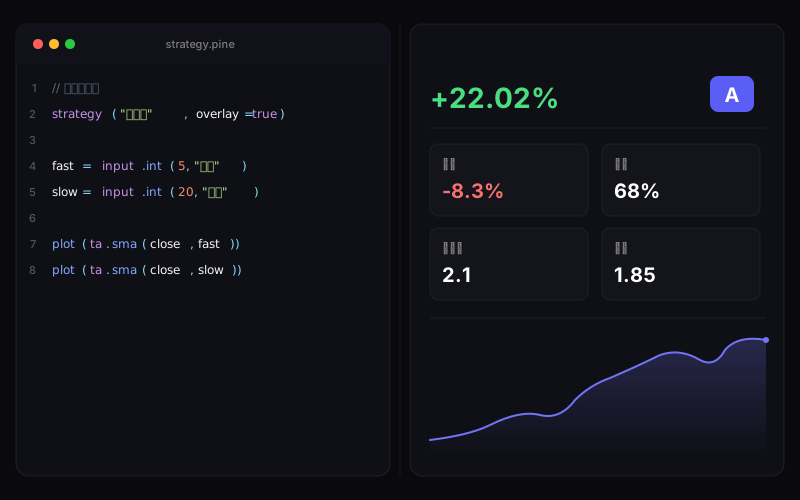
Import scripts written in familiar Pine syntax
Unsupported syntax is reported line by line at import
Edit, debug and version your strategies in the workspace
Backtests that charge you fees
You want to know if the edge survives costs — not what an idealized fill history looks like.
What TideView does
Every run models fees, slippage and position sizing, splits data in-sample / out-of-sample, and runs walk-forward windows. Optimization flags overfitting.
What you see
Per-window results show where the strategy holds and where it breaks. Pro and above scan it across whole symbol lists.
The boundary
Backtest results are based on historical data and never guarantee future performance. Results are sensitive to costs, liquidity and market regime changes.
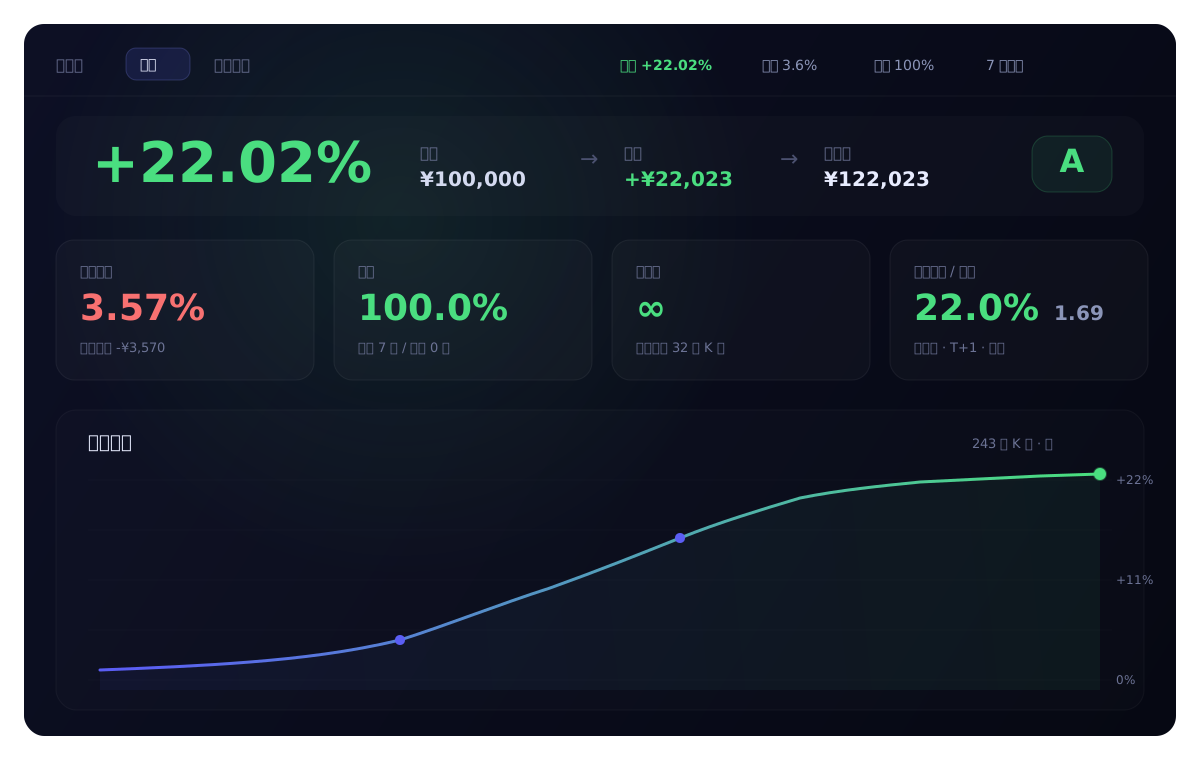
Fees, slippage and position sizing modeled into every run
Automatic in-sample / out-of-sample splits
Walk-forward windows with per-window results
Parameter optimization with overfitting warnings
Batch scanning across symbols (Pro and above)
AI that checks your work
You want a second pair of eyes on the logic before capital touches it.
What TideView does
The assistant explains what the strategy actually does, flags risky assumptions, and organizes evidence, counter-evidence and invalidation conditions.
What you see
Drafted fixes and variations, ready for your approval — nothing runs until you say so. Capacity scales with plan.
The boundary
AI output is organized information and assistance, not investment advice. It never issues buy or sell instructions.
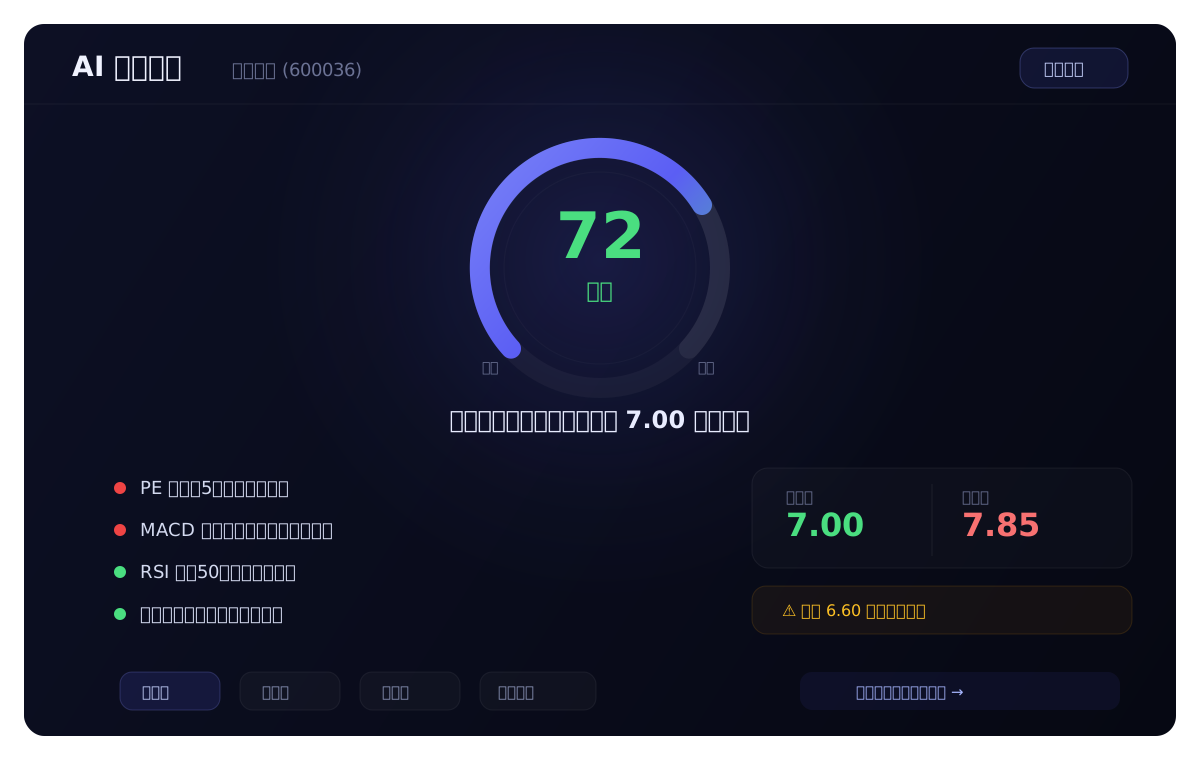
Explains strategy logic and flags risky assumptions
Organizes evidence, counter-evidence and invalidation conditions
Drafts fixes and variations you approve before anything runs
Capacity scales by plan; heavy runs use the compute add-on
Replay the trades that decided the result
A summary statistic will not tell you why a strategy won or lost. The bars will.
What TideView does
Step through history bar by bar with your strategy marks in place. Key trades are annotated for inspection.
What you see
Sessions save as notes attached to the strategy, so the review compounds instead of evaporating.
The boundary
Replay is hindsight tooling for review — past sequences do not predict future ones.
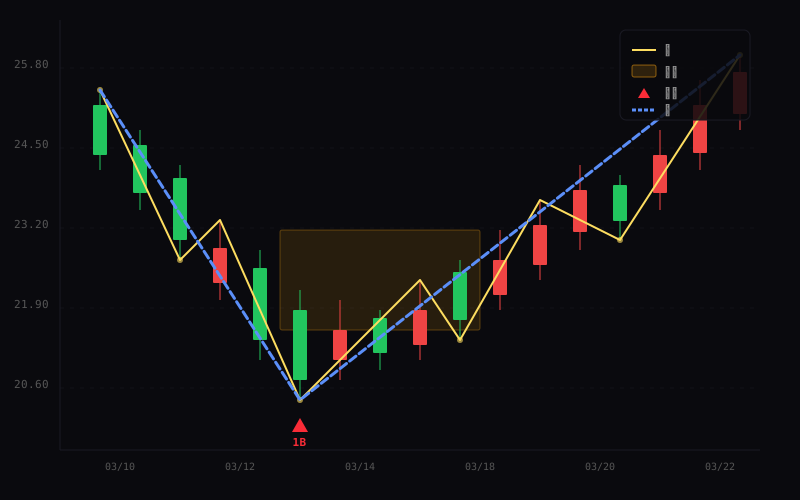
Step through history bar by bar with your strategy marks
Key trades annotated for inspection
Save sessions as notes that stay attached to the strategy
Reports you can rerun, not screenshots
You want conclusions you can revisit next month and still trust.
What TideView does
Every validation records its data source, range, parameters and cost assumptions, under a unique report ID.
What you see
Rerun any report to verify it. Compare runs across parameters, symbols and timeframes side by side.
The boundary
A reproducible result is still a historical result. It informs judgment; it does not replace it.
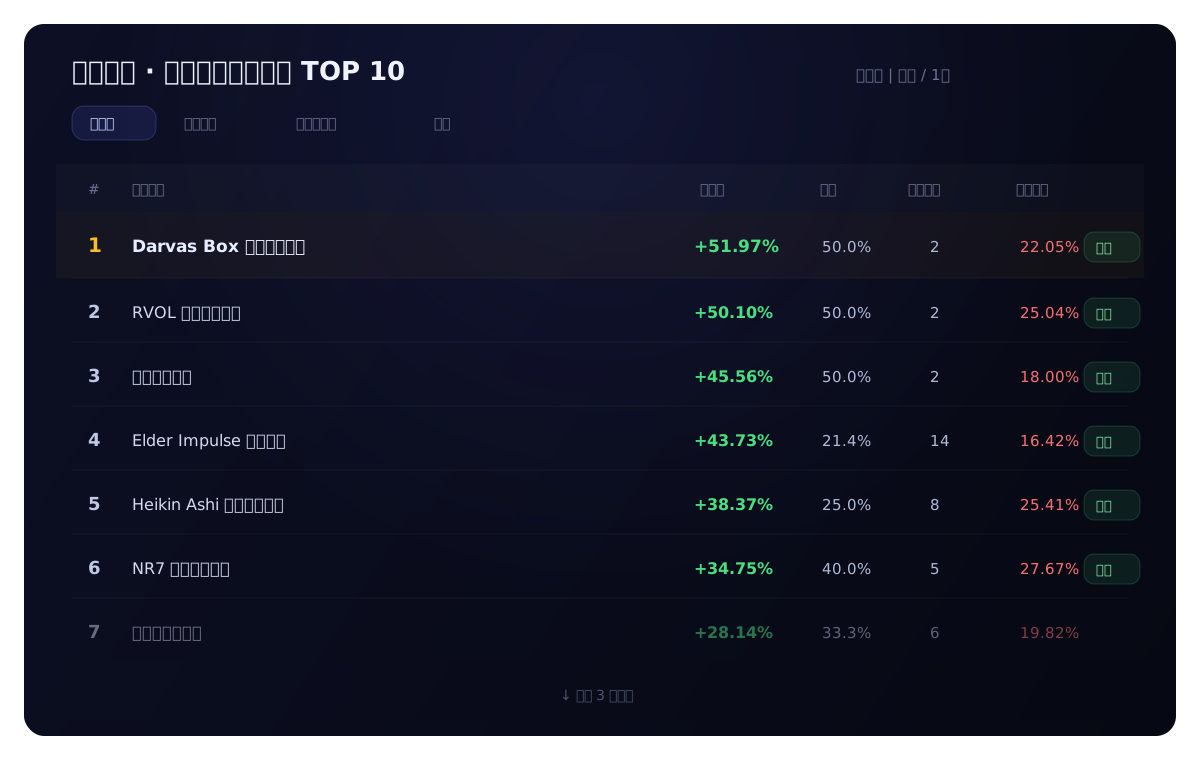
Every validation records data source, range, parameters and costs
Reports carry a unique ID and can be rerun to verify
Compare runs across parameters, symbols and timeframes
Put one real idea through the loop
Free plan includes 3 complete validations and a 7-day Pro trial.
For research and education only. Not investment advice. Markets involve risk.